> ## Documentation Index
> Fetch the complete documentation index at: https://koreai-ai-for-service-dev.mintlify.site/llms.txt
> Use this file to discover all available pages before exploring further.
# Feedback Dashboard
[Back to Analytics Overview](/ai-for-service/analytics/overview#overview-dashboards)
The Feedback Dashboard provides prebuilt analytics views to monitor and analyze customer feedback survey responses, scores, and trends over a given period.
After creating a Feedback Survey based on a survey type (NPS, CSAT, or Like/Dislike), you can use this dashboard to gain actionable insights into the customer experience. It displays:
* Distribution trends of feedback scores.
* The overall score for the given period and its trend.
* Comprehensive feedback results with an option to export.
## View the Feedback Dashboard
1. Click **Analytics** on the left navigation pane. The Analytics panel displays the list of reports.
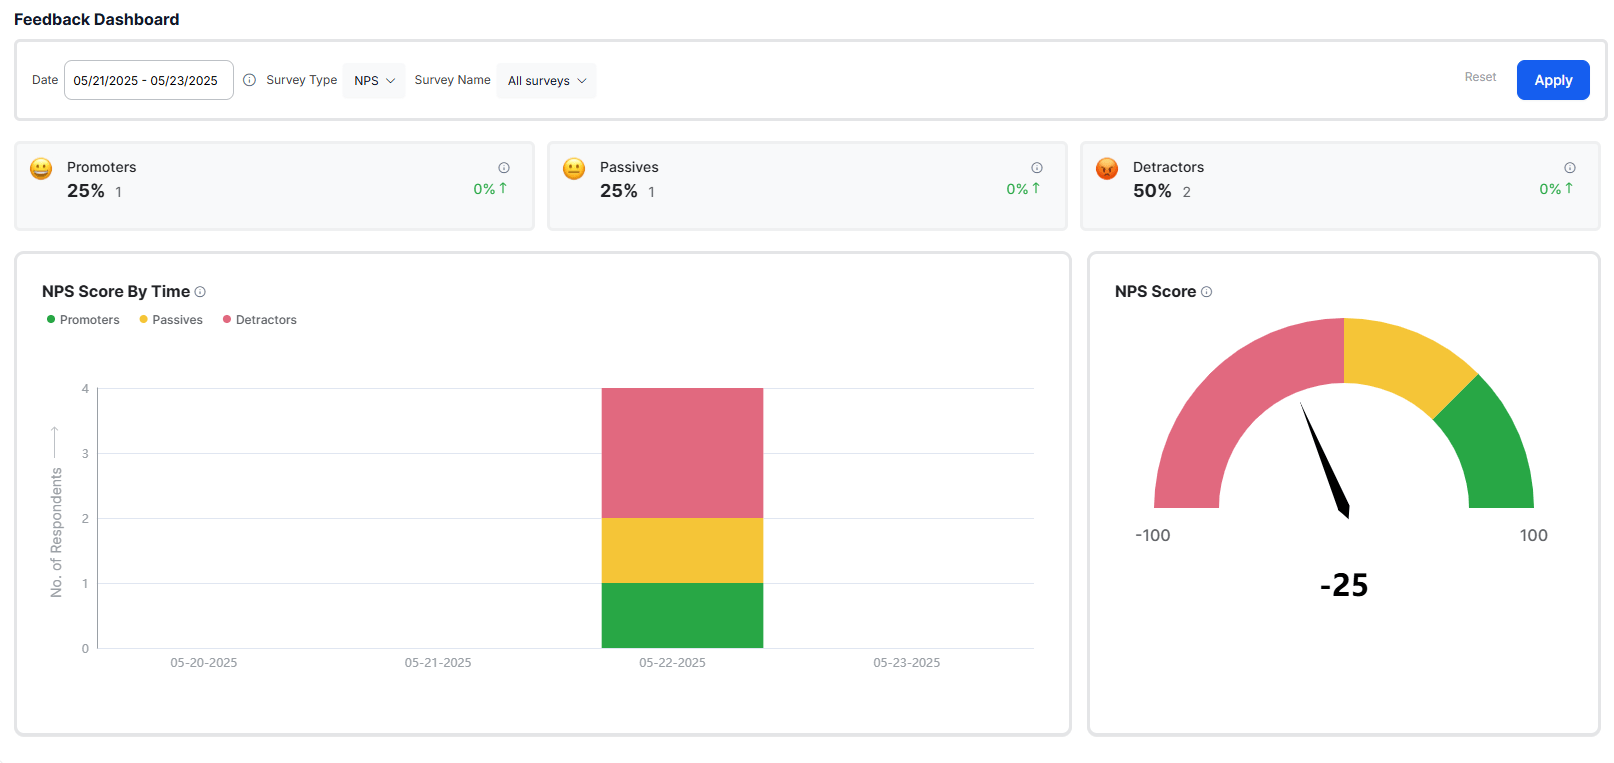 2. Click **Feedback Dashboard** under the **Automation** section of the Analytics panel. The Feedback Dashboard appears on the right side of the page.
3. Select the appropriate filters and click **Apply**.
***
## Dashboard Filters
The Feedback Dashboard filters analytics data on feedback survey responses based on the following criteria.
**Date**: Filters conversation sessions by date range based on session start time.
The session start time is used to filter sessions.
2. Click **Feedback Dashboard** under the **Automation** section of the Analytics panel. The Feedback Dashboard appears on the right side of the page.
3. Select the appropriate filters and click **Apply**.
***
## Dashboard Filters
The Feedback Dashboard filters analytics data on feedback survey responses based on the following criteria.
**Date**: Filters conversation sessions by date range based on session start time.
The session start time is used to filter sessions.
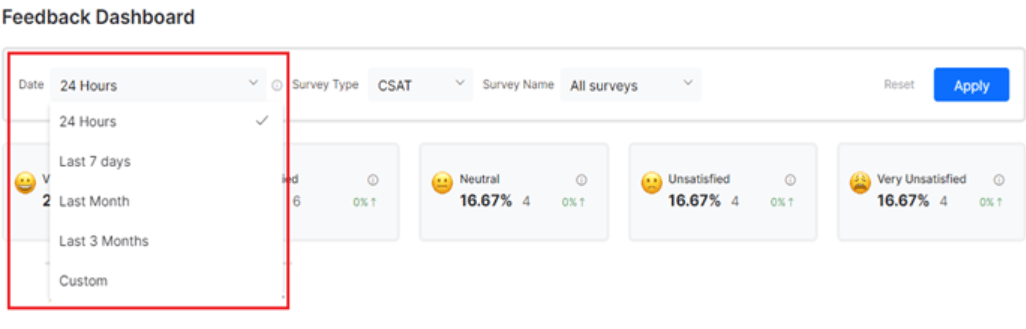 Date filter options:
* **Last 24 Hours**: Feedback from conversations in the past 24 hours.
* **Last 7 Days**: Feedback from conversations in the past seven days.
* **Last 30 Days**: Feedback from conversations in the last 30 days.
* **Last 90 Days**: Feedback from conversations in the last 90 days.
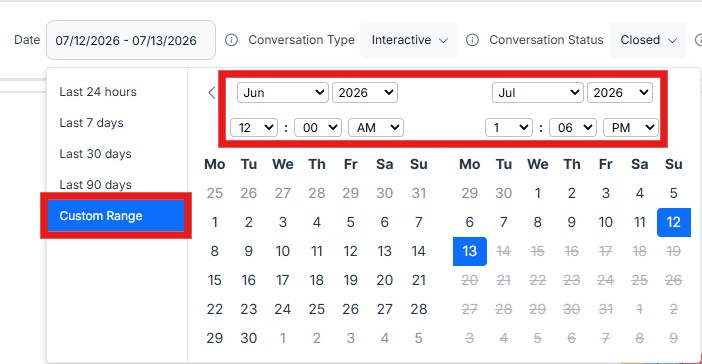
* **Custom**: Helps in filtering dashboard data and exports using precise start and end date-time values, including hours and minutes.
Date filter options:
* **Last 24 Hours**: Feedback from conversations in the past 24 hours.
* **Last 7 Days**: Feedback from conversations in the past seven days.
* **Last 30 Days**: Feedback from conversations in the last 30 days.
* **Last 90 Days**: Feedback from conversations in the last 90 days.
* **Custom**: Helps in filtering dashboard data and exports using precise start and end date-time values, including hours and minutes.
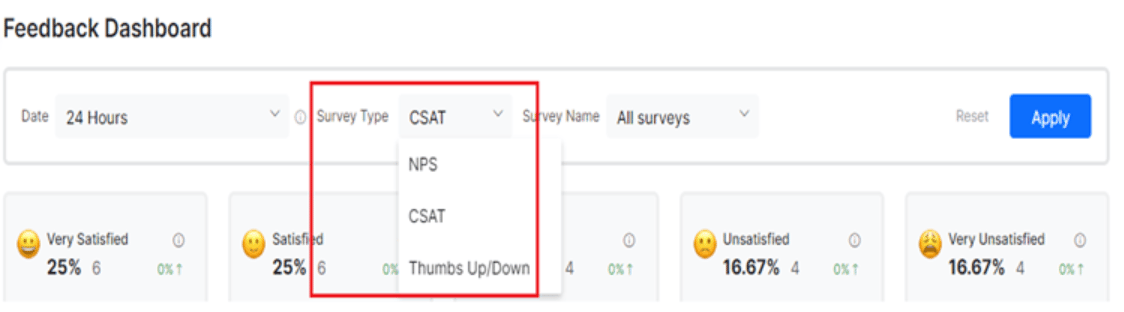
 **Survey Type**: Filter by CSAT, NPS, or Like/Dislike.
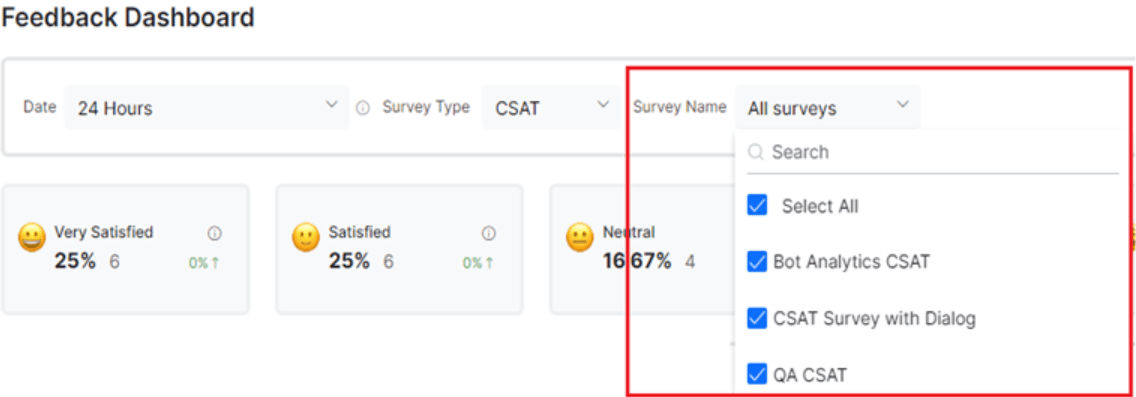
 **Survey Name**: The name of the feedback survey, configured under **Build** > **Configurations** > **Feedback Survey**. Select **All Surveys** to view data for all configured surveys, or choose a specific survey from the dropdown.
 ***
## Dashboard Sections
The Feedback Dashboard is organized into five sections based on the selected survey name, survey type, and date.
### Percentage and Number of Respondents
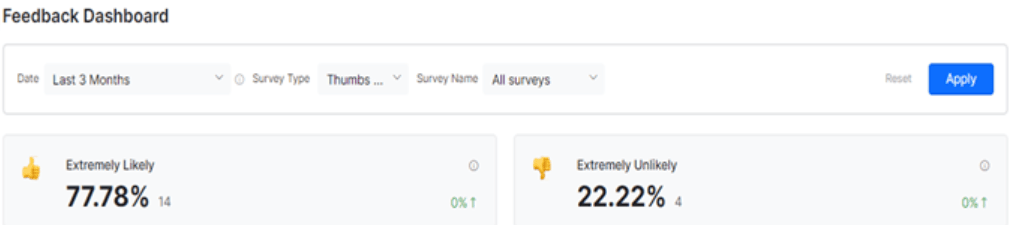
This widget displays the percentage and number of respondents for a specific feedback survey response, along with the percentage increase or decrease over the given period.
For **NPS** surveys:
* **Promoters**: Respondents with a score of 9 or above.
* **Passives**: Respondents with a score between 6 and 8.
* **Detractors**: Respondents with a score between 0 and 5.
***
## Dashboard Sections
The Feedback Dashboard is organized into five sections based on the selected survey name, survey type, and date.
### Percentage and Number of Respondents
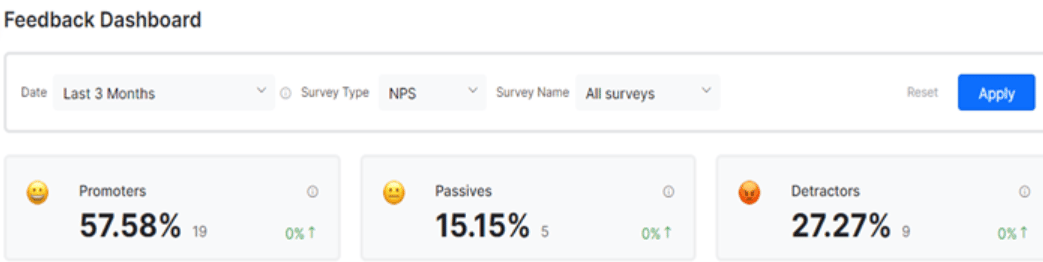
This widget displays the percentage and number of respondents for a specific feedback survey response, along with the percentage increase or decrease over the given period.
For **NPS** surveys:
* **Promoters**: Respondents with a score of 9 or above.
* **Passives**: Respondents with a score between 6 and 8.
* **Detractors**: Respondents with a score between 0 and 5.
 For **CSAT** surveys:
* **Very Satisfied**: Score of 5.
* **Satisfied**: Score of 4.
* **Neutral**: Score of 3.
* **Unsatisfied**: Score of 2.
* **Very Unsatisfied**: Score of 1.
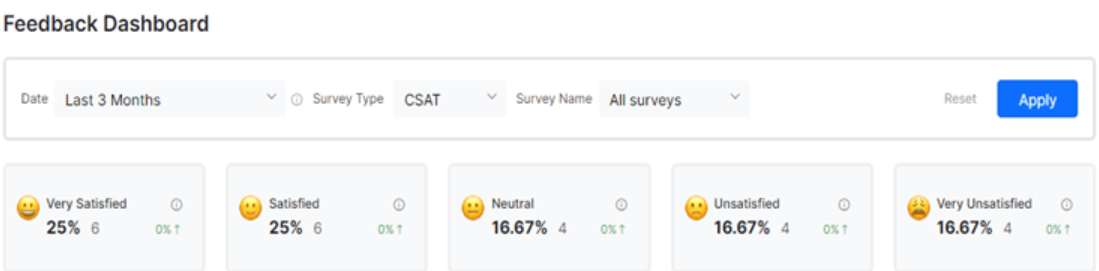
For **CSAT** surveys:
* **Very Satisfied**: Score of 5.
* **Satisfied**: Score of 4.
* **Neutral**: Score of 3.
* **Unsatisfied**: Score of 2.
* **Very Unsatisfied**: Score of 1.
 For **Like/Dislike** surveys:
* **Extremely Likely**: Score of 1.
* **Extremely Unlikely**: Score of 0.
For **Like/Dislike** surveys:
* **Extremely Likely**: Score of 1.
* **Extremely Unlikely**: Score of 0.
 ***
### Score Breakup — Respondent-wise Survey Score over Time
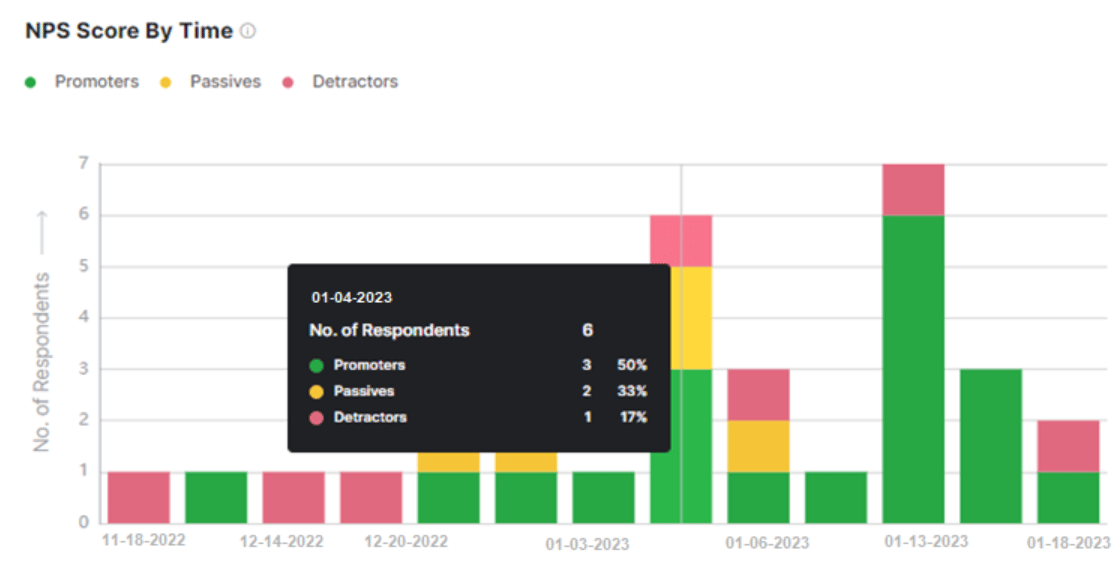
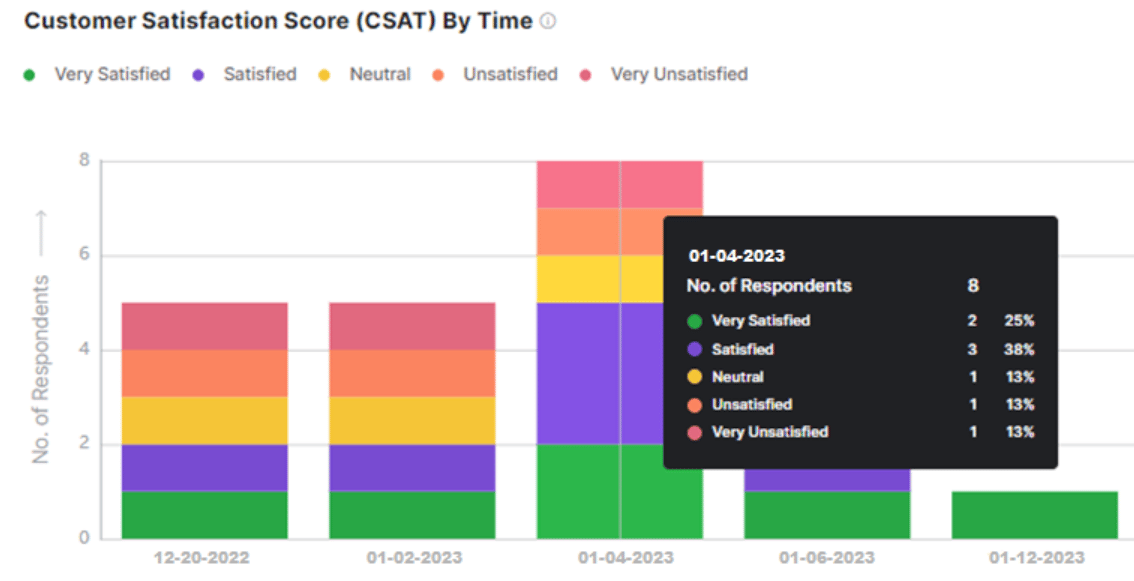
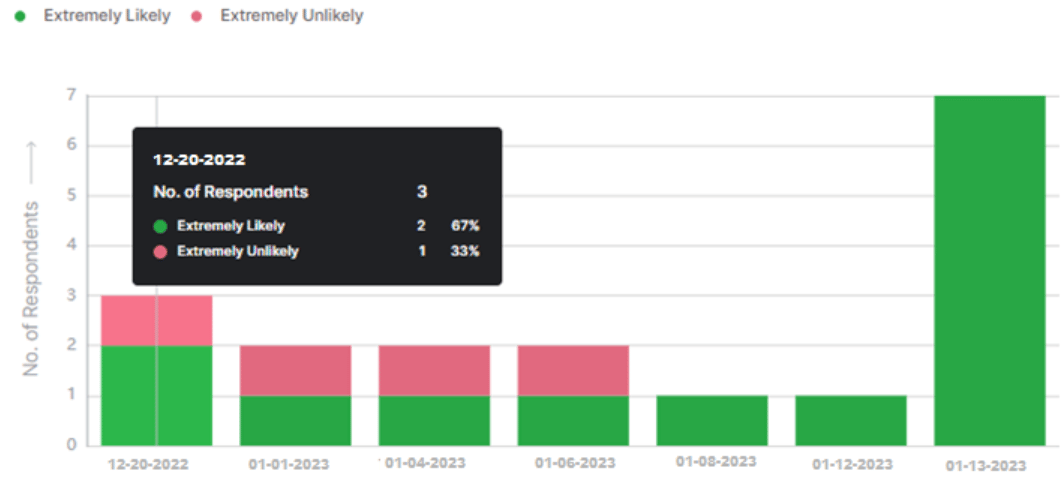
This section displays a bar chart showing the percentage of each response type for Like/Dislike and CSAT surveys, or respondent type for NPS surveys, over the selected time period.
Hover over the Survey Score chart to see the number of respondents, response type scores, and percentage of respondents for each response type at a granular level.
For **NPS** surveys: Shows the number of promoters, passives, and detractors in different colors for the days they responded.
***
### Score Breakup — Respondent-wise Survey Score over Time
This section displays a bar chart showing the percentage of each response type for Like/Dislike and CSAT surveys, or respondent type for NPS surveys, over the selected time period.
Hover over the Survey Score chart to see the number of respondents, response type scores, and percentage of respondents for each response type at a granular level.
For **NPS** surveys: Shows the number of promoters, passives, and detractors in different colors for the days they responded.
 For **CSAT** surveys: Shows the number of very satisfied, satisfied, neutral, unsatisfied, and very unsatisfied responses in different colors.
 For **Like/Dislike** surveys: Shows the number of extremely likely and extremely unlikely responses in different colors.
 ***
### Survey Score
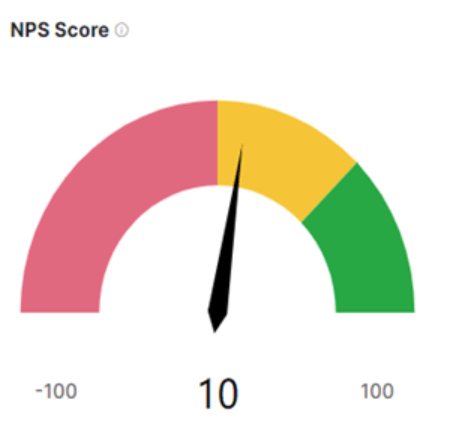
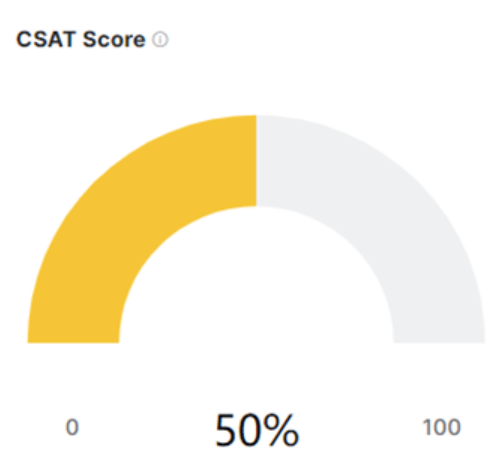
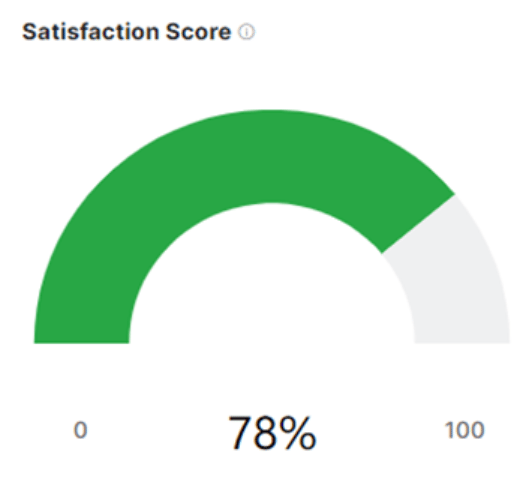
This section displays a meter graph (0 to 100) for the survey score based on actual customer feedback. Each score is calculated using a formula specific to the survey type.
* **NPS Score**: A whole number between -100 and 100. Formula: `(Percentage of Promoters - Percentage of Detractors)`.
***
### Survey Score
This section displays a meter graph (0 to 100) for the survey score based on actual customer feedback. Each score is calculated using a formula specific to the survey type.
* **NPS Score**: A whole number between -100 and 100. Formula: `(Percentage of Promoters - Percentage of Detractors)`.
 * **CSAT**: A percentage value. Formula: `(Number of very satisfied/satisfied Respondents / Total Respondents) * 100`.
 * **Like/Dislike**: A percentage value. Formula: `(Number of extremely likely Respondents / Total Respondents) * 100`.
 ***
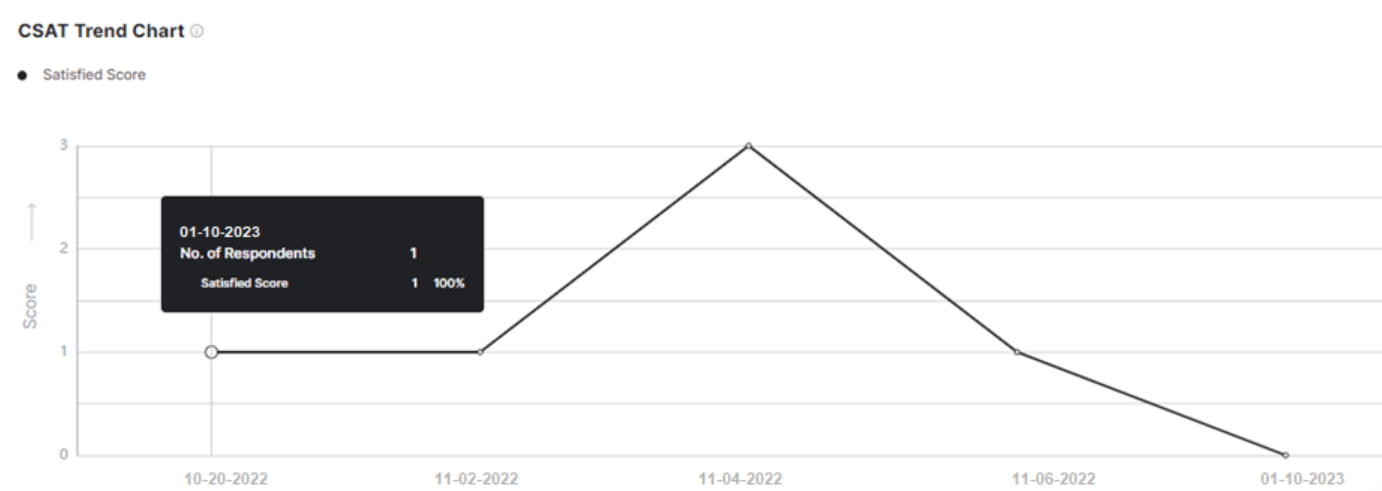
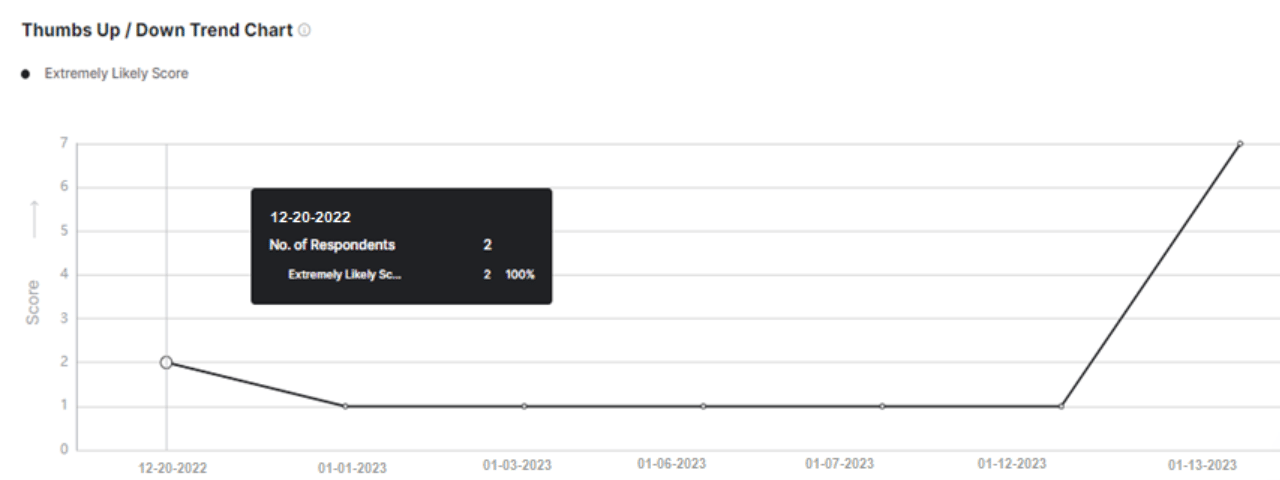
### Survey Trendline
This section displays a line graph capturing the date-wise response score trend for positive respondents over the selected date range.
Hover over the trend chart to see the number of respondents and response scores on a specific date at the granular level.
For **NPS** surveys: Shows the Promoters score trend over the selected period.
***
### Survey Trendline
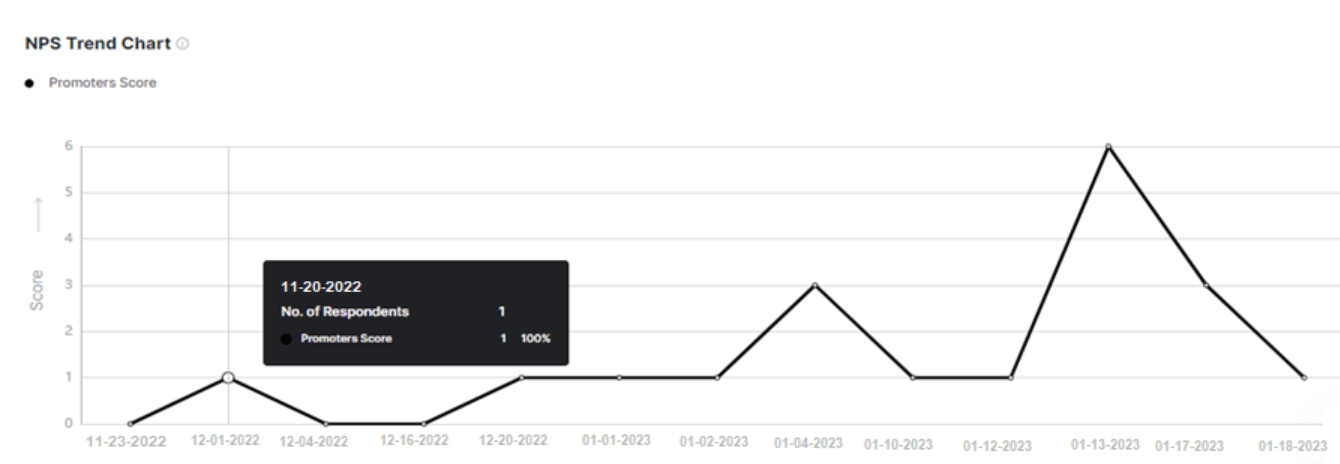
This section displays a line graph capturing the date-wise response score trend for positive respondents over the selected date range.
Hover over the trend chart to see the number of respondents and response scores on a specific date at the granular level.
For **NPS** surveys: Shows the Promoters score trend over the selected period.
 For **CSAT** surveys: Shows the Respondents Score trend for very satisfied and satisfied respondents over the selected period.
 For **Like/Dislike** surveys: Shows the respondents' score trend for extremely likely respondents over the selected period.
 ***
### User-level Feedback
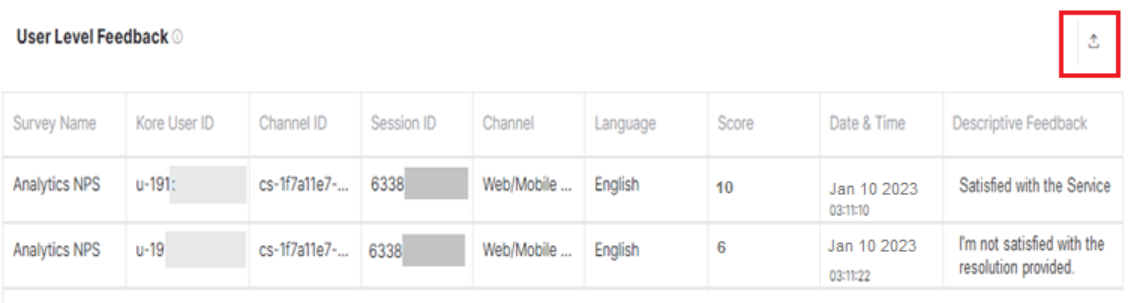
This grid represents metadata for all conversations mapped to the selected survey type. The following fields are displayed:
| Field | Description |
| ------------------------ | --------------------------------------------------------------------------------------------------------------------------------- |
| **Survey Name** | Name of the feedback survey for the selected survey type. |
| **Kore User ID** | Internal ID of the user who responded to the survey. |
| **Channel ID** | Channel ID of the conversation session. |
| **Session ID** | Identifier of the conversation session. |
| **Channel** | Conversation channel (web/mobile client or messaging platform). |
| **Language** | Language used during the conversation session. |
| **Score** | Feedback survey score. |
| **Date & Time** | Date and time of the interaction. |
| **Descriptive Feedback** | User's response to a follow-up question triggered during the feedback survey. Appears only if a follow-up question is configured. |
The values for Score and Survey Name change based on the selected Survey Type.
***
### Download the Feedback Analytics Report
To download the User-level Feedback report, click the **Export to CSV** icon.
***
### User-level Feedback
This grid represents metadata for all conversations mapped to the selected survey type. The following fields are displayed:
| Field | Description |
| ------------------------ | --------------------------------------------------------------------------------------------------------------------------------- |
| **Survey Name** | Name of the feedback survey for the selected survey type. |
| **Kore User ID** | Internal ID of the user who responded to the survey. |
| **Channel ID** | Channel ID of the conversation session. |
| **Session ID** | Identifier of the conversation session. |
| **Channel** | Conversation channel (web/mobile client or messaging platform). |
| **Language** | Language used during the conversation session. |
| **Score** | Feedback survey score. |
| **Date & Time** | Date and time of the interaction. |
| **Descriptive Feedback** | User's response to a follow-up question triggered during the feedback survey. Appears only if a follow-up question is configured. |
The values for Score and Survey Name change based on the selected Survey Type.
***
### Download the Feedback Analytics Report
To download the User-level Feedback report, click the **Export to CSV** icon.